My World
the state that I am inSeptember 12, 2005 Archives
12 September 2005
Marathon finish times
Personally, I kept no particular track of the race time, or my own pace on a mile by mile basis during the race. However once I passed the last corner, I could see the clock above the finish time, which was just reaching the 2:08 mark. At this point I figured if I pushed it, I could make it inside 2:10, and sprinted the finish. I'm also pretty sure if the time said 2:11 I wouldn't have bothered.
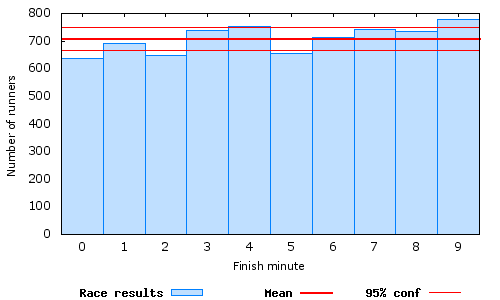
I would therefore hypothesise that the number of people finishing in a time ending in a nine will be greater than any other digit. Similarly I thing the quarter hour marks would be attractive for similar reasons, therefore 4s are to be expected too.
In the histogram below, the last digit of the finishing time in minutes has been calculated. This clearly fits the hypothesis.
My A-level statistics somewhere in the back of my head tells me that:
Actual Hypothesis: Finishing time is influenced by human desire to beat certain time barriers.
Null Hypothesis: Finish time is random, therefore probability of a runner finishing in a time ending in a "9" is 0.1
- Assume the Null hypothesis is true.
- Using binomial theory calculate probability of 779 or more runners out of 7086 finishing in a time ending in 9.
- If probabilty is less than 5%, Null Hypothesis is rejected and Actual Hypothesis is accepted.
The 95% confidence interval is between 666 and 750 successes.
Update
Bit of a thinko there. 666—750 is the 90% confidence limit for the mean (assuming binomially distributed, p=0.1, n=7086). The 95% confidence limit is more like 659—757. Can't be bothered to update the graph.12 September 2005
Marathon time distribution

- The median time is 2:02:02
- The mean time is 2:05:45
12 September 2005
Robin Hood Half Marathon
Although the position itself isn't that stunning (61% of people beat me), I was only six minutes behind the median time.
The main achievement for me though was not only finishing the race (which I was never 100% sure I could manage), but actually running the whole way.
I also took part in the Cooper Parry Corporate Relay Challenge on behalf of Freeth Cartwright, because somebody dropped out. The teams consist of 5 runners each completing around 2.5 miles each. Somewhat bizarrely I manage to beat my own team.
I although I didn't set out with the intention of raising money for charity, and haven't collected any sponsorship, it would be great if somebody benefitted from my efforts yesterday and my inability to walk today. Therefore if anybody feels inclined to donate, I will be donating money to the State School for the Deaf in Ghana, where my sister worked on her year out.